002 — E-Commerce Analytics

Amazon
Product Catalog
Analytics

Full-stack analytics pipeline ingesting 1.4 million Amazon product listings from Kaggle into PostgreSQL. Cleaning, SQL analysis, and a Python-generated dashboard revealing pricing patterns, rating distributions, and purchase behavior across hundreds of categories.

Full-Stack Analytics ETL Pipeline 1.4M Rows Python PostgreSQL SQL Pandas Matplotlib Power BI Kaggle API
View on GitHub

2023

Data Analyst

Solo Project

E-Commerce

Kaggle · Amazon Products Dataset

1.4M
Products Ingested
248
Product Categories
257M+
Total Customer Reviews
$43.38
Avg Listed Price
Process
Workflow
01
Ingest
Authenticated Kaggle API, downloaded 1.4M-row Amazon products CSV directly into the pipeline.
02
Clean
Parsed price strings, computed discount percentages, removed nulls and duplicates, renamed columns to snake_case using Pandas.
03
Database
Loaded cleaned data into PostgreSQL via SQLAlchemy in 50K row chunks with indexes on category, price, stars, and best seller flag.
04
Analyze
Wrote SQL queries joining the products and categories tables. Extracted price tiers, rating distributions, and purchase snapshots.
05
Visualize
Generated a production dashboard in Python (Matplotlib) and built an interactive Power BI report.
Visualization
Product Catalog
Dashboard
Amazon Product Catalog Analytics — 2023 Snapshot
Source: Kaggle · Amazon Products Dataset 2023 · 1,426,336 products
Total Products
1,426,336
All categories combined
Avg Listed Price
$43.38
Across all products
Avg Star Rating
4.00 ★
Out of 5.0 stars
Total Customer Reviews
257M+
Cumulative all time
Last Month Buys
202M+
2023 snapshot period
Total products by category — top 10
Avg customer reviews by star rating (0.5 increments)
Product count by listed price tier
Last month purchases by category — top 5
202M
total buys
Key findings
$10–$25 is the sweet spot 40.8% of all catalog products are priced between $10 and $25 — the most competitive price band on the platform.
4.5★ products dominate purchases Products rated 4.5 stars average 434 monthly purchases — nearly 5× the average of 3.0★ products.
Kitchen & Dining leads purchases 10.4M units purchased last month — highest of any category despite not having the most listings.
What I Found
Key Findings
Pricing Insight
$10–$25 Dominates
40% of the Catalog
Over 581,000 products. 40.8% of the entire Amazon catalog in this dataset are priced between $10 and $25. This band has the highest listing density, signaling intense seller competition at accessible price points.
40.8%of products priced $10–$25
Rating vs Purchases
Higher Ratings Drive
Exponentially More Buys
Products at 4.5 stars average 434 monthly purchases versus just 97 at 1.0 stars. The jump from 4.0★ to 4.5★ accounts for the largest single increase in purchase velocity across the catalog.
4.5×more purchases at 4.5★ vs 1.0★
Category Insight
Most Listed ≠
Most Purchased
Girls' Clothing has the most product listings (28,619) but Kitchen & Dining leads monthly purchases by a wide margin (10.4M units). This reveals market saturation in clothing versus genuine demand in household essentials.
10.4MKitchen & Dining last-month buys
Stack
Tools & Data
Data Source
  • Kaggle — Amazon Products Dataset 2023
  • 1,426,336 product listings
  • 248 product categories
Software Used
  • Python (Pandas, Matplotlib, SQLAlchemy)
  • PostgreSQL + pgAdmin
  • SQL (window functions, CTEs, joins)
  • Jupyter Notebook (Anaconda)
  • Power BI
  • Kaggle API
  • Chart.js
Project Lifecycle
From Raw CSV
to Dashboard
01
Problem
Define the Question
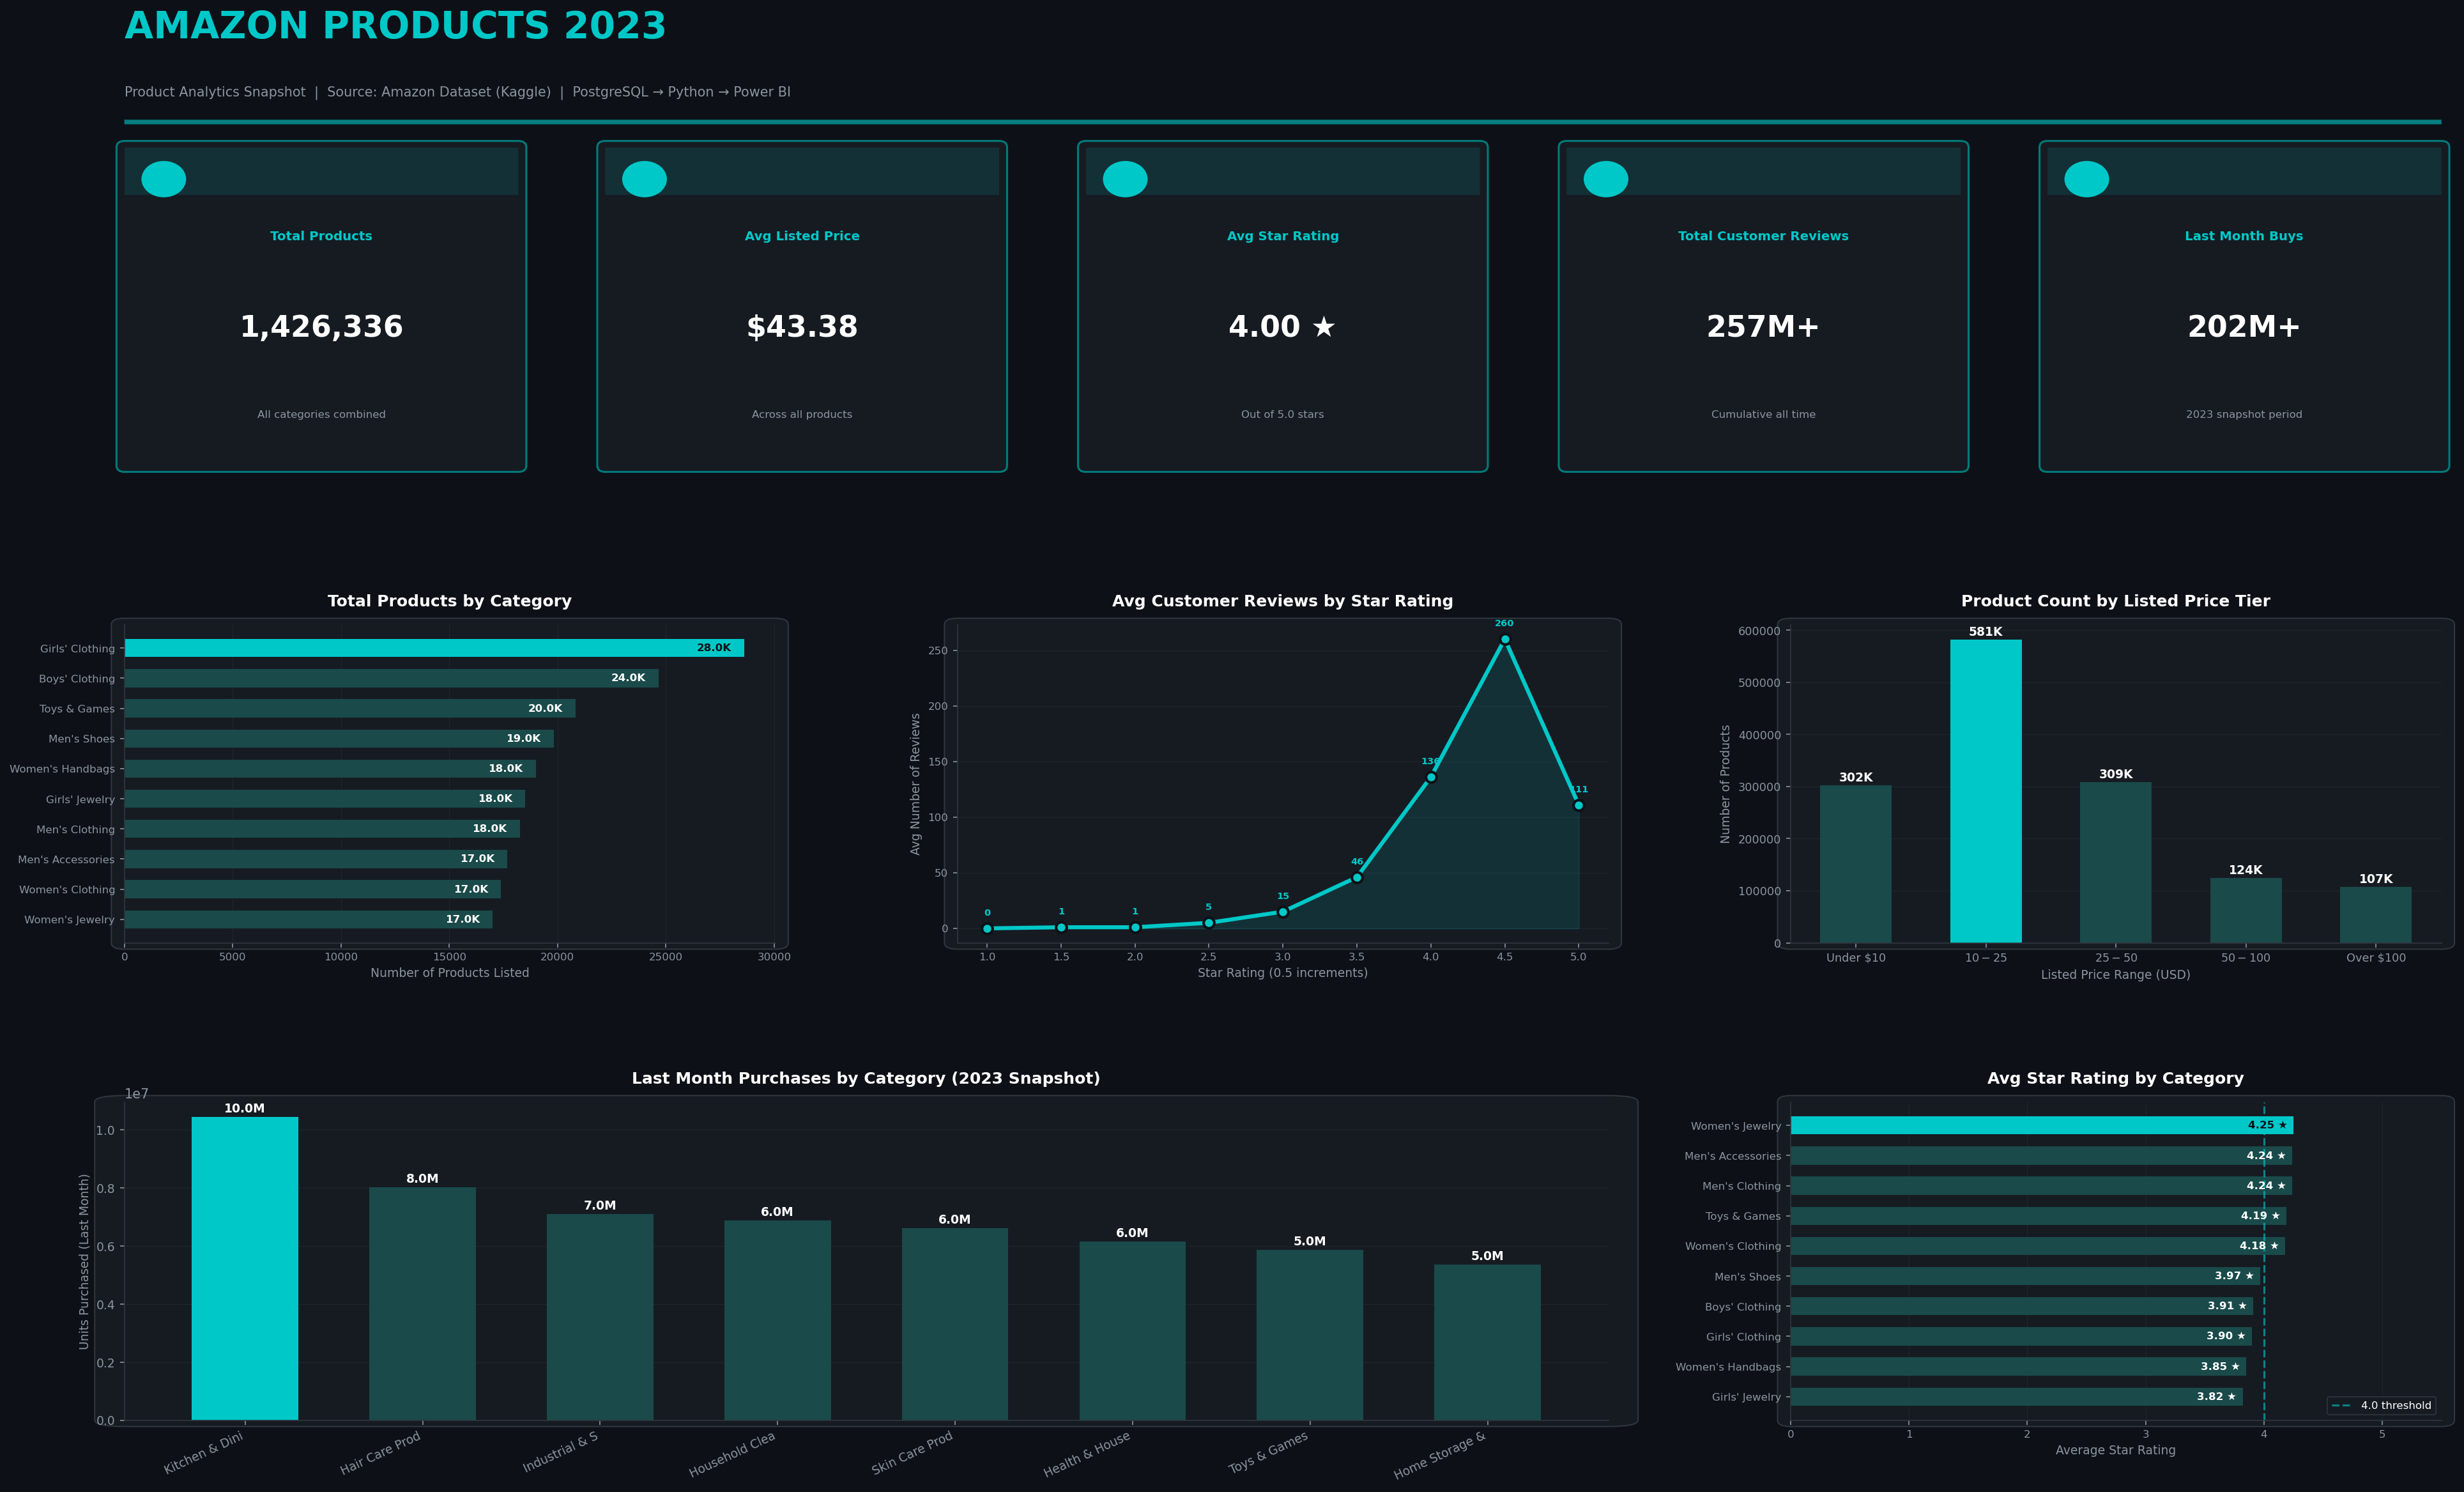
What does Amazon's product catalog actually look like at scale? What is the relationship between price, rating, purchase behavior and which categories dominate by listings versus actual sales?
02
Collect
Kaggle API Ingestion
Authenticated the Kaggle API and downloaded the Amazon Products Dataset (1.4M rows) programmatically. Raw data included messy price strings, nulls, and uncategorized entries requiring significant cleaning before analysis.
03
Build
PostgreSQL Pipeline
Cleaned and normalized data using Pandas, then loaded into PostgreSQL via SQLAlchemy in 50K-row chunks. Joined the products table with the categories lookup table on category_id. Created indexes on key columns for query performance at 1.4M row scale.
04
Analyze
SQL Analysis & Export
Wrote SQL queries for price tier segmentation, rating distributions, best seller breakdowns, and last-month purchase snapshots. Exported results as CSVs for downstream visualization in both Python and Power BI.
05
Ship
Dual Dashboard Delivery
Delivered two dashboard outputs: a static production-quality dashboard generated entirely in Python (Matplotlib/GridSpec) and an interactive Power BI report with DAX measures, slicers, and drill-through filters for stakeholder exploration.
Power BI Dashboard Amazon Product Catalog Analytics DAX · Slicers · Drill-through
Amazon Product Catalog Analytics — Power BI Dashboard
← Previous Project
NY Medicaid
Provider Coverage Gap
View project →
Next Project →
Cancer Patient
Risk Factor Analysis
View project →